What is Business Intelligence
In the literature, Business Intelligence (BI) is cited as the process of transforming data into information.
In fact, BI captures the detailed information needed to make strategic decisions.
According to the IOC magazine:
“Although business intelligence does not tell business users what to do or what will happen if they follow a certain direction, it also cannot be said that BI is only about generating reports. Rather, BI provides a way for people to examine data to understand trends and derive insights.”
What Business Intelligence is for
Organizations can use insights gained from business intelligence and data analysis toimprove business decisions,identify problems,spot market trends, and find new revenue or business opportunities.
BI keeps the organization abreast of developments, and success depends largely on knowing who in the marketplace is doing what, where, when, why, and how.
BI functionality allows for:
Benefits of business intelligence tools
Because business intelligence toolsspeed up information analysis and performance evaluation, they are useful in enabling companies to reduce inefficiencies, flag potential problems, find new revenue streams, and identify areas for future growth.
Some of thespecific benefitsfor companies adopting BI include:
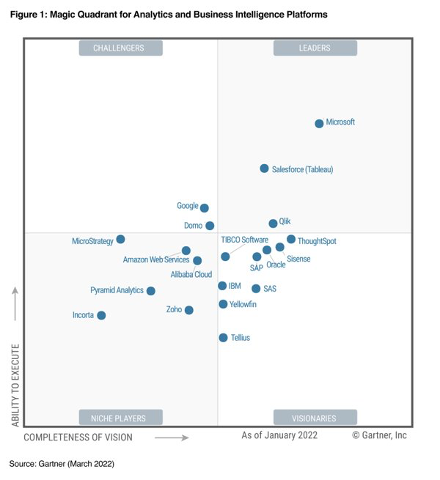
The Gartner Quadrant
TheGartner Magic Quadrantis the culmination of research in a specific market that provides awide-angle view of relative positions of market competitors.
For example, the Gartner Quadrant of Analytics and Business Intelligence Platforms provides a graphical positioning of four types of technology “vendors” in markets where growth is high and vendor differentiation is stark
- Leadersexecute well with respect to their current vision and are well positioned for tomorrow;
- Visionariesunderstand where the market is going or have a vision to change the rules of the market, but they do not yet behave well;
- Niche Playerssuccessfully focus on a small segment or lack focus and fail to overcome innovation.
- Challengersperform well today and may dominate a large segment, but they do not demonstrate an understanding of market direction.
QlikSense and Power BI Comparison
Two of the three SWs featured as leaders in the Gartner 2022 quadrant are analyzed below:QlikSense and Microsoft Power BI. The comparison is made by following the steps necessary for the creation of any report/application.
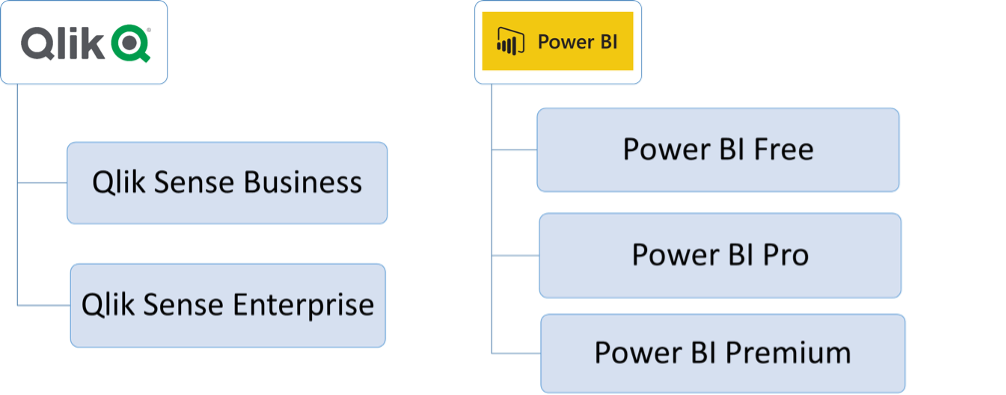
1. Products
First of all, it is necessary to have one of the two SWs available.
QlikSenseoffers two types of licensing:
Power BIoffers three types of licenses:
2. Data source connection
Next, we need to have adatabase availableon which to build our report/application.
QlikSense and Power BI both offer the ability to uselocal, cloud-based data sources and a wide range of external sourceconnectors. Simply create the connection to the desired data source to import the data into the relevant report/application.
Specifically, Power BI hastwo modes of connection:

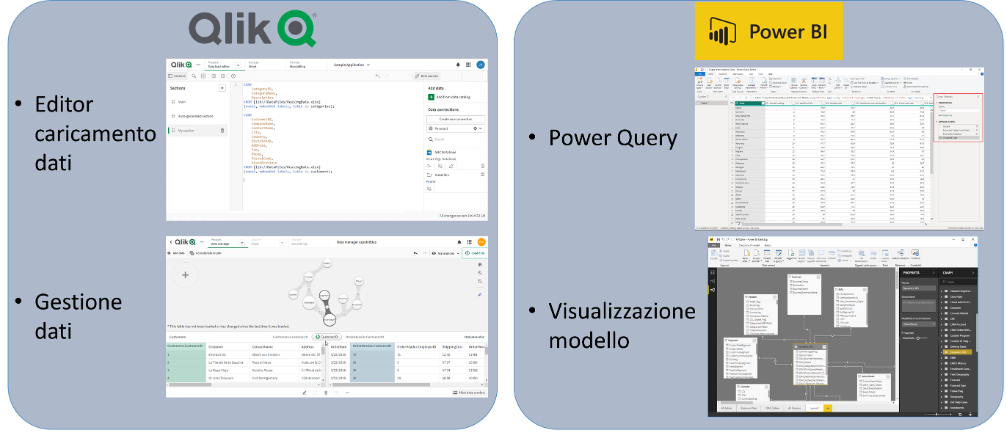
3. Back-end development (Data model)
At this point, theETL operationsnecessary to create the report/application data model can be performed. This step is critical for the correct display of data in the application and for its operation.
QlikSenseallows these steps to be carried out intwo ways:
Power BIallows these steps to be carried out throughtwo features:
4. Front-end development (Interface)
Then,the interface with which end users will interact can bedeveloped.
Both SWs allow a variety of chart types to be created and various features to be integrated into the report/application. The development of abasic interfaceis within reach for any type of user.
In case you want to develop more complex functionality or perform particular filters in the data model,you need to resort toadvanced scripting: for QlikSense you have“Set Analysis,” for Power BI you have the“DAX” language.
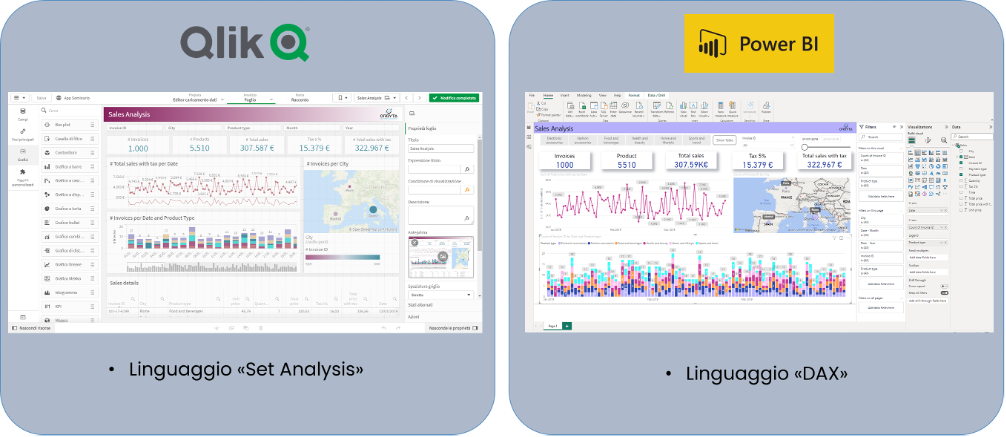
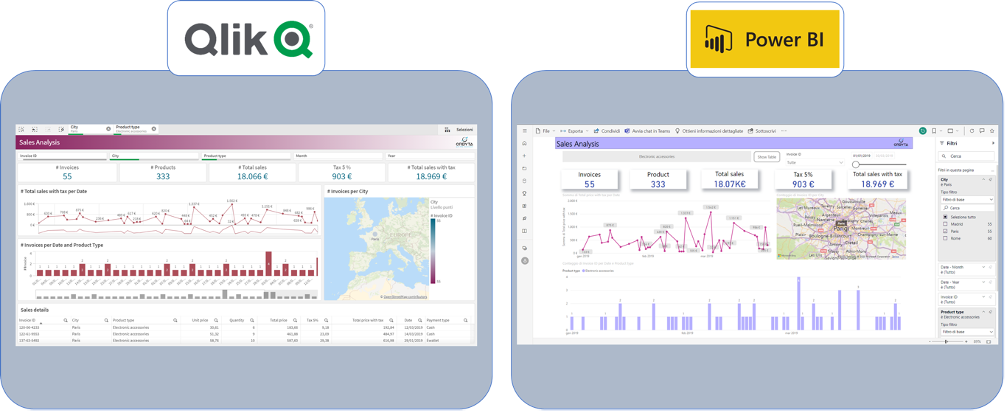
QlikSense and Power BI interface
Finally, the application can be released to end users.
Theuser experienceis very similar for the two SWs: the basic concept is to give the user the ability to filter the data with special filters or by clicking on the various visualizations; the rest of the visualizations will change accordingly showing the data recalculated against the selections made.
How to choose the right BI SW for our needs
There are many SWs on the market for developing BI projects; therefore, it is useful to understand which tool is best suited to our needs.
We refer to Tableau’s“Evaluation Guide: how to choose the ideal modern business intelligence and analytics platform”:
The following types ofkey roles are assumed to be present and participate in the different stages of the evaluation:
Themain features of the SWto be considered are:
1. Platform integration and accessibility
– Can all stages of the modern analysis workflow be easily addressed in the platform, without having to move between modules/products discontinuously?
– Can all stages of the modern analysis workflow be addressed without involving IT or other specialized personnel?
2. Ease of use
– Is it easy for BI platform administrators to install, configure and manage the platform?
– Is it easy for content authors to prepare data and curate data sources without initial or ongoing assistance from IT staff?
– Is it easy for authors to create content and access the platform’s analytics functions without the need for initial or ongoing assistance from IT staff?
– Is it easy for non-technical content consumers to find and view available analytics content, and interact with it?
– Is it easy for non-technical content consumers to ask more in-depth questions on their own and customize existing published content according to specific needs?
3. Capabilities attributed to users
– Is specific training available for different roles? Is it accessible to all users?
– Are there tutorials and/or webinars available for users to attend whenever they wish?
– Is it easy for users to search and find answers to specific product questions?
– Is there a stable, active, and accessible user community where best practices, tips, and other content are shared?
– What is the reputation of the platform provider regarding the ability to solve technical problems?
– Are professional services by the provider or partners available in a timely manner?
– What is the reputation of the platform provider regarding its ability to ensure customer success and to interact with customers on an ongoing basis?
4. Deployment Flexibility
– Does the platform offer flexible deployment options (e.g., SaaS, public/private cloud deployment, local, etc.)?
– Does the platform offer flexible data storage options (e.g., database storage or on-platform (in-memory) storage)?
– Does the platform support hybrid connectivity of data sources on-premises and on the cloud?
– Can the platform be expanded to accommodate increasing volumes of data and new users, over time?
– Can the platform be easily expanded and scaled according to the needs of the organization?
5. Pricing and packaging
– Is the product packaging easy to understand?
– Are clear and transparent licensing options available?
– Do the licensing options offer adequate functionality and fair value for money?
– Is the platform’s pricing model easy to understand?
– Is the platform’s pricing model flexible and scalable?”
Condividi tramite