Introduction to Network Science
Networks (or networks) are a powerful and effective tool for representing the reality around us and are in fact present in almost every aspect of our lives. Friends, relatives, the Web, the streets of a city-all can be modeled in the form of networks. The purpose of this representation is to study a system by trying to capture its complexity and its causes. In general, a network is a simple description of a set composed of interconnected entities, which we call nodes, and their connections/relationships, which we call links. Nodes can represent all sorts of entities: people, places, websites, cells, etc. Relationships in turn can express any kind of interaction/exchange/flow that occurs between two entities, so payments, message exchanges, Facebook likes, etc.
Note: In this article, social networks should be understood as social networks and not as social networking sites such as Facebook and Twitter.
Social networks are a particular kind of network where the nodes are people interconnected by some kind of relationship. There are so many types of social networks that this is the most studied category of networks ever. For example, sociology, the branch from which the study of social networks started, tries to establish rules emerging from the collective behavior of individuals.In the field of medicine one can study the propagation of diseases through a social network, in economics one studies how the behavior of one individual influences that of another based on mechanisms of incentives and expectations of others. In the field of research, social networks are used to study the most influential authors and how they collaborated with each other in the study of a given topic.
The complexity of modern society’s connections given by phenomena such as the Internet, financial crises or epidemics is given by the aggregate behavior of groups of people whose actions have consequences for the behavior of everyone else. The growing interest in the study of such complexity has made Social Network Analysis one of the most widely used tools for visualizing and representing complex systems.
Graph Theory
Social Network Analysis and in general all of Network Science builds on the key concepts of node and link graph theory, going on to expand this branch of mathematics with its own set of terms and metrics given by the autonomous development of this field of research.
The advent of graph theory can be traced back to a 1736 anecdote from the Prussian city of Königsberg, the hometown of Immanuel Kant and Leonhard Euler, Euler to us. Euler was faced with a mathematical problem related to the city of Königsberg, which was divided at the time into four sectors by the Pregel River, connected by seven bridges. Only five of these survived the bombings of World War II, and likewise many buildings were demolished. The problem Euler grappled with, unsolved until then, was to connect all seven bridges by being able to pass only once over each of them.
Euler formalized the problem by resorting to a graph whose nodes were the four sectors of the city, and the links were the bridges. He thus showed that such a path exists only if all the nodes have equal degree (number of links) except the start and finish. This type of path, later renamed Eulerian path in his honor, is not actually possible in this system because each of the four nodes has an odd number of connections. The real novelty of this approach was that it formalized the problem in topological form, going so far as to define this type of path as an intrinsic property of the graph.
The strength of weak links and Small-World property.
The “strength of weak ties” theory originated from a 1960s study by Mark Granovetter that has since become a classic of sociology. Granovetter, through a series of interviews, went to study how people who had recently changed jobs in Boston came to know about the new opportunity. Most of these people were Irish immigrants, who used to spend a good amount of time in pubs. Work and particularly construction work, the main sector of these people, was very unstable leading to frequent transitions from employment to unemployment status. The initial goal of the research was to understand the role of pub conversations in the search for new work.He found that many people had found their new jobs through personal contacts and therefore decided to dwell on these. It emerged from his research that these contacts were mostly acquaintances rather than close friends. Only 30 percent of the respondents had found jobs through close contacts.
Source : https://www.nature.com/articles/srep05739/figures/2
Hence the distinction between strong and weak ties. Strong ties were friends and relatives, while weak ties were mere acquaintances. Granovetter then theorized that strong ties are more willing to provide emotional support, but belonging to the same circle as the person in this case who is looking for a job, they are less likely to provide information we do not know. Weak ties in contrast, belonging to circles distant from us are in touch with realities unknown to us and therefore have access to new information. The implications of this study are vast and still being studied. Why social media has become such a powerful tool can be traced precisely to the concept of weak ties. Essentially, social media merely maintain and amplify weak ties, defined in this case as social ties that require no emotional attachment, need to communicate or time to devote. Despite this, they are extremely powerful in that they serve as channels for passing information between people who are distant in both physical and social terms (e.g., income, culture, etc.). When two people communicate through a weak link, the information that passes through it is usually new, and comes from a different point of view.
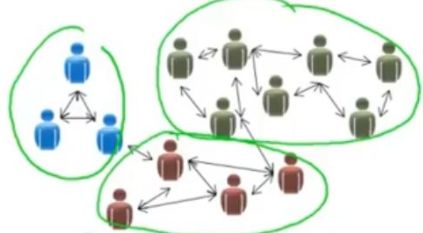
From the perspective of networks, strong ties (such as those between spouses and close friends) tend to bring nodes together in tight, densely interconnected clusters. Within these clusters, specific knowledge is developed but “distant” content-level knowledge is not generated. Because different niches store different types of knowledge, it is the links between these sub-networks that enable sharing. Such links are called bridges. Granovetter thus understood that in social networks, the links that hold the network itself together are, paradoxically, the “weak” links.
The famousSix Degrees of Separation Theoryis based on this very concept, namely, that through simple weak links any two people on the globe are able to make contact through up to six people. The experiment was conducted in the 1960s by Stanley Milgram, a date to which dates the first empirical evidence for the existence of so-called small world networks. The idea was to measure the social distance between strangers. Thus, 160 people in Kansas and Nebraska were selected to send a letter to a selected person in Massachusetts. Each person was to send the letter to the person of his or her acquaintance whom he or she thought would be most likely to reach the recipient. In this case only 26 percent of letters reached their destination correctly, showing, however, that the average number of intermediaries was just over 6. The experiment was repeated in 2003 using email, however. Again it highlighted the fact that the average path in terms of people were 5-7 individuals. Most real-world networks have the critical (fastest) average very short path, according to what is called the small word property. This property makes networks very efficient in terms of information propagation speed.
Source : https://mathspig.wordpress.com/tag/6-degrees-of-separation-explained/
Clustering
One characteristic observed in social networks is that individuals tend to aggregate into communities, called clusters. This property, already known in sociology as transitivity, was later taken up in network science as clustering. As such, this coefficient expresses a measure of how many friends of an individual are in turn friends with each other. At the network level it is calculated as the fraction of all possible triangles (or triads) that exist in the network, while at the individual node level it corresponds to the fraction of all possible triangles that contain the node under consideration.
One of the ways by which clusters are formed is by proximity to another node. This concept is also covered extensively in Social Network Analysis, and is called assortativity. It expresses the preference for a node to interact with another node having similar characteristics. In the case of social networks, these characteristics can be gender, age, location, topics of interest, and so on. Some researchers have seen that it is possible to determine an individual’s political orientation with some accuracy even if it is not present in his profile by looking at the characteristics of his circle of friendships. One rule of thumb is that if two people are similar in some way, they are more likely to select each other and become two interconnected nodes. Related to this is Eli Pariser’s filtering bubble theory, which would be interesting to explore further, but that is beyond the scope of this article.
Watts-Strogatz Model
To study how features of a network, such as small world property or clustering, emerge, simulation algorithms are used to generate models. These models are then compared with real data to understand their differences and study their mechanisms.
The Watts-Strogatz (1998) model is a network having small world properties that at the same time possesses a good clustering coefficient. It can be generated experimentally resulting in a network where most nodes are connected to a relatively small number of neighbors on a fairly regular basis, with some exceptions given by weak links to distant nodes. Watts and Strogatz noted that in the real world, neither regular networks, where all nodes are closely related to their neighbors, nor completely random networks, where instead the links between nodes follow no particular logic, were found in almost any situation. In fact, they observed that the surrounding reality was always somewhere in between these two types of networks, that is, a strong aggregation in clusters typical of a regular network and at the same time a strong propensity to propagate information according to the small world property, typical instead of a random network. The solution they proposed is therefore the interpolation of these two extremes.
The Watts-Strogatz model generation algorithm starts with a regular network where all nodes are connected to their neighbors, and randomly eliminates some of these links by replacing them with links to more distant nodes. In this way, local topological properties between neighboring nodes remain intact, but weak links are allowed to act as links to even very distant nodes.
The problem with Watts-Strogatz networks is the inaccuracy in the degree distribution (the number of links of each node).The number of neighbors of a node is in fact about the same for all nodes, and differs slightly from the mean value, thus following a Poisson distribution. This results in a very homogeneous network, which does not, however, reflect the distribution of real networks. Indeed, in the real world there is a very strong inequality between the degree of nodes, according to what is called the “power law,” that is, there are many nodes with few connections and few nodes with many connections. Barabasi and Albert considered this by going on to create a model that is based on the power law.A distribution that follows the power law is called power law distribution, scale invariance distribution (scale-free distribution) or also Pareto distribution. The peculiarity of this type of distribution lies precisely in the absence of a characteristic scale of the phenomena.
Scale free and Barabasi-Albert Model
The Barabasi-Albert (1999) model departs from the Watts-Strogatz model by adding realism in the clustering mechanism of new nodes. While the Watts-Strogatz model starts with a set of nodes from beginning to end, the Barabasi-Albert adds nodes one at a time making the model dynamic.
The basic idea is to generate a network according to a progressive aggregation of nodes following a logic of preference toward larger nodes, called preferential attachment. In other words, when new nodes are added, they will tend to connect to already largely interconnected nodes, which are called hubs.
This principle is also referred to as “rich get richer,” meaning that larger nodes tend to get even larger. The probability of a new node connecting to an old one is proportional to the degree of the old node. For example, a node with degree 10 is 10 times more likely to be joined by a new node than another node having degree 1. The small-world property is in this case ensured precisely by hubs, which act as the main bridge between pairs of unconnected nodes.
Source : https://en.wikipedia.org/wiki/Mediation-driven_attachment_model
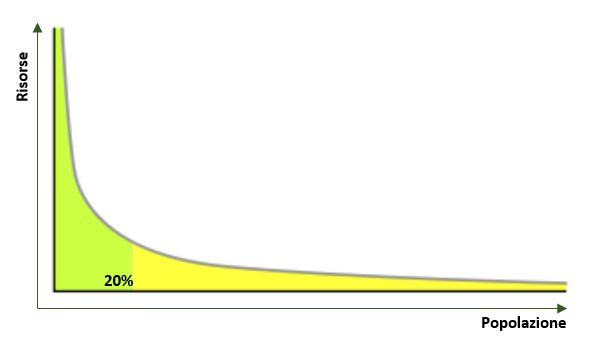
This type of model finds a very wide application in the real world, such as Web pages. Numerous studies have shown that the more a site is cited, i.e., has more hyperlinks, the more likely it is to be cited again and vice versa. The underlying cause of this phenomenon is explained by the fact that the more hyperlinks a Web site has, the more visible it is, consequently, the more likely the site is to receive other hyperlinks.This same mechanism manifests itself in the same way in Pareto’s law, whereby wealth tends to be concentrated in the hands of a few very wealthy individuals while it is very scarce in the rest of the population (20 percent of the population owns 80 percent of the resources, or 20 percent of the words of a language make up 80 percent of the speech).
Measures of centrality
By shifting the analysis to the individual node level within the network, SNA allows the study of the relationships of each actor in the network by showing their hierarchies and providing a framework to explain the structure and evolution of individual nodes and groups of nodes. Social networks are complex systems and as such need a multitude of metrics and analysis tools. The main ones are centralities, but there are also degree distribution, local network topology, community structure and network evolution.
The first question that might arise when analyzing a network is: who is the most important?
Obviously the answer is it depends, and here we are going to briefly explain why.
Generally, measures of centrality answer this question. Centrality measures are used to calculate the importance of an individual within the network, however, there are various criteria for importance: power, influence, or other individual characteristics of people. For this reason, there are several measures of network centrality. We will analyze the four main ones.
Degree centrality
If you want to measure the number of connections an individual has then degree centrality does the trick. On Facebook for example it would correspond to the number of our friends. It is logical to think that the more connections a person has, the more influence they have on other people. But that is not necessarily the case.Scott Adams, the creator of the comic strip Dilbert, argues that a person’s power is inversely proportional to the number of keys in his or her key ring. A janitor has keys to all the offices and no power. The CEO does not need a key; there is always someone to open the door for him. Effectively, there are many cases in which a power person has relatively few contacts, so other metrics of centrality are needed.
A brief digression can be made regarding the two sub-measures of degree-centrality given by the number of incoming or outgoing links of a node, namely in-degree and out-degree centrality. This aspect is interesting because it is used to measure the level of trust toward an individual in the network. Simplifying greatly (as many other aspects would have to be taken into account), an actor with a low trust value can be identified by a high out-degree centrality value to which correspond low out-degree centrality values of the actors with whom it communicates. This can be explained by the fact that this actor feels safe in disseminating information, but other actors do not disseminate this information because they do not consider this information trustworthy.
Source : https://cambridge-intelligence.com/social-network-analysis/
Closeness centrality
Another way to measure centrality is to look at how “close” a node is to other nodes. Closeness centrality is used to measure the average length of the shortest path from a node to any other node. Maksim Tsvetovat and Alexander Kouznetsov call it the gossiper measure because it represents an actor’s ability to transmit or share information from one side of the network to the other. The smaller the total distance in the network, the higher the closeness centrality will be. In other words, it represents the speed with which information can reach other nodes from a given starting node: gossippers get information through much faster than others.
Betweeness Centrality
Betweenness centrality is a measure that is used to study the role of a node in the propagation of a piece of information. If a node is the only bridging link between two other nodes, it can be said to have a somewhat privileged or strategic position. Betweeness Centrality goes to measure precisely this value. In fact, it is often used to measure traffic in transportation networks. It is calculated by going to count how many times a node is crossed by a critical path (the shortest path, or also Eulerian path) compared to the total number of critical paths.
If there is a structural hole (a form of discontinuity in the flow of information) in a network, the person holding the intermediary position can take a strategic position to connect or disconnect nodes in a group, and thus enjoys a competitive advantage over other nodes. Actors with a high value of betweeness centrality are like gatekeepers who control the flow of information among others.
Generally, nodes having high betweeness are those also having high degree centrality, as they are the so-called hubs we described above. However, this is not the case when a node is going to connect two different and simply disconnected regions of the network. In this case the node may have few connections to other nodes, but act as a bridge between two very distant regions of the network.
Trying to put the pieces together, we can say that a node having high betweeness centrality can correspond to one of the two ends of a weak Granovetter bond, which in turn grants a network the small world property seen above.
Eigenvector Centrality
The saying “tell me who your friends are and I will tell you who you are” is translated in social network analysis into the centrality of the self-vector.
This measure gives us information about an actor based on the relationships he has with his neighbors, that is, his closest contacts. Again Maksim Tsvetovat and Alexander Kouznetsov found the perfect analogy, namely Don Vito Corleone. He in fact with previous measures of centrality could not have been recognized as the boss, since he does not have many direct connections and does not exchange many words around. Here, then, is the usefulness of eigenvector centrality.Essentially it is based on Bonacich’s algorithm, which iteratively calculates a weight for each of a node’s links based on that of neighboring actors. It can be defined as an extension of degree-centrality since it goes to look at this very metric in the neighbors, and in fact an actor with high eigenvector centrality is connected to nodes having many connections in turn.
Pagerank
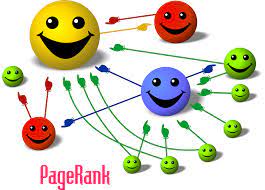
Similar to Eigenvector Centrality in that it is based on the same principle of recursive weight calculation is pagerank, the algorithm developed by Larry Page as an essential part of early versions of Google to index Web pages. PageRank is a measure of centrality that calculates the prestige of a node, understood as a Web page. Web pages are the nodes of an oriented graph where the links between nodes are the hyperlinks to the page itself (links to the page found on other Web pages). The rank of a node is calculated as the probability that a person randomly happens upon that page by clicking a link.
This process is known asrandom walk, and it is a simple simulation of how the user navigates the Web. The page with the highest ranking index is then the most likely destination. One might think why not use in-degree centrality directly then? PageRank is much more efficient in this case because it takes into account the importance of the page from which the hyperlink came. That is, if the target page is cited by the Wall Street Journal it will rank much higher than a page cited by a spam site.
Conclusion
As we have seen in this article, SNA is an extremely powerful and fascinating analysis tool that can be used in conjunction with many other models in the context of data science. One of these is game theory, with which it is possible to apply some of the analyses we have discussed, as we will see in future articles.
Condividi tramite